2023.11.02
細胞外囊泡(EVs)是從細胞中釋放出來的納米級囊泡,具有強大的自分泌和旁分泌生物學活性。EV已被認為構成了一種細胞間通信的基本模式,可在各種情況下介導特定蛋白質、核酸和脂質轉運到受體細胞中。因此,EV參與多種疾病的發病機理,包括感染、神經退行性疾病、心血管疾病和癌癥等。
外泌體是一種直徑約為30-200nm的EV,由於大小低於光學顯微鏡的衍射極限,直接可視化一直令人望而生畏,因此生理條件下的單顆粒研究也受到阻礙。在本研究中,我們使用英國Oxford Nanoimaging公司研發的隨機光學重建顯微鏡(dSTORM )—Nanoimager對數百個EV進行了3D可視化,根據蛋白標記物定量了亞群,並在單個EV顆粒表面定位了四次跨膜蛋白,為EV的異質性、結構和復雜性提供了新的見解。
數據展示
1. 表達CD81-mCherry和CD63-GFP的細胞產生具有熒光和內吞能力的EV
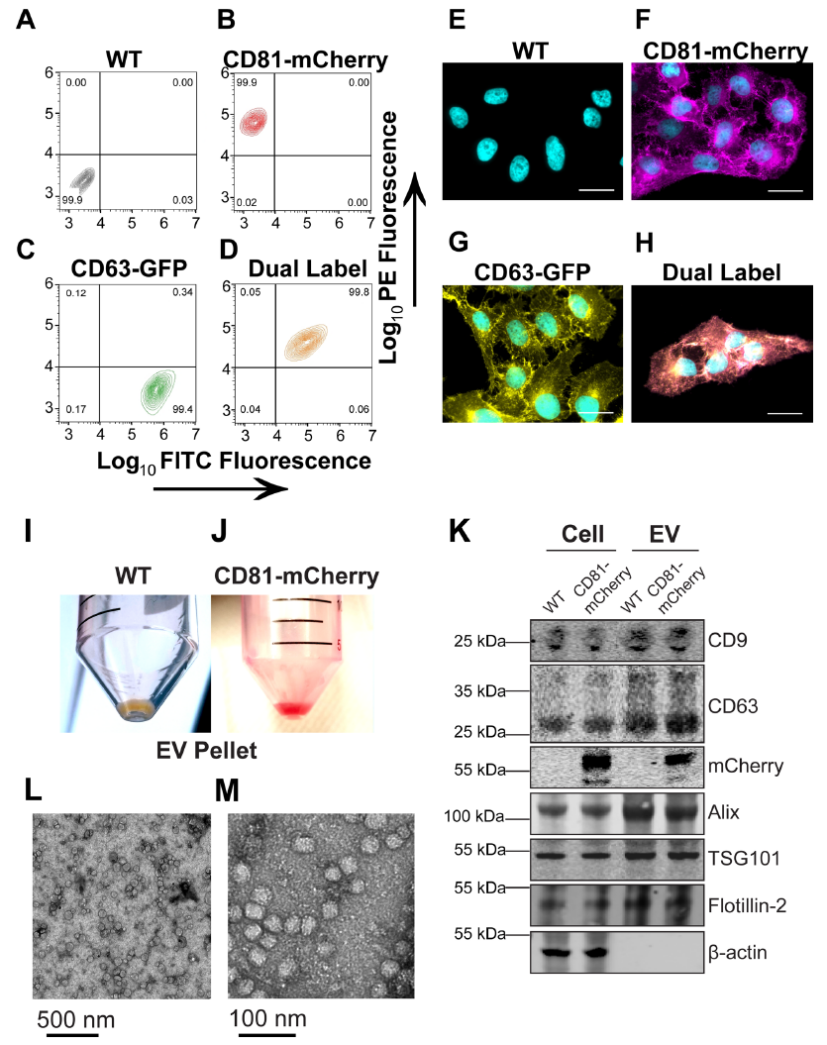
圖1.克隆性CD81-mCherry細胞的產生
(A–D) U-2 OS cells were transfected with the indicated plasmid and selected via FACS and cell populations were analysed for clonal expansion via flow cytometry. (E–H) Fluorescence microscopy of cells sorted in A-D (scale bar = 20 μm). (I) EV pellet from U-2 OS WT cells. (J) EV pellet from U-2 OS CD81-mCherry cells. (K) Western blots of cell and EV pellets of U-2 OS WT and CD81-mCherry cells. (L) Transmission EM view of negatively stained affinity-purified CD81+ EVs. (M) Zoomed-in view of a cluster of CD81+ EVs imaged by transmission EM.
四次跨膜蛋白(如CD9、CD63和CD81)是外泌體和其他小EV的常用標記物,可能與ILV貨物選擇或生物發生有關。在此我們創建了表達綠色熒光蛋白(GFP)標記的CD63或mCherry標記的CD81或兩者的克隆U-2 OS細胞系。流式細胞術驗證表達穩定(圖1A-D),99%以上的細胞表達報告蛋白。與正常加工和運輸一致,蛋白質沿著細胞膜和囊泡區室富集(圖1E–H)。透射電鏡顯示出EV預期的球形形態和尺寸(圖1L-M)。通過流式細胞術測量(未顯示)和共培養測定法(未顯示)兩種方法測定,CD81-mCherry EVs具有攝取能力。
2. CD63和CD81在細胞同一囊泡內共定位
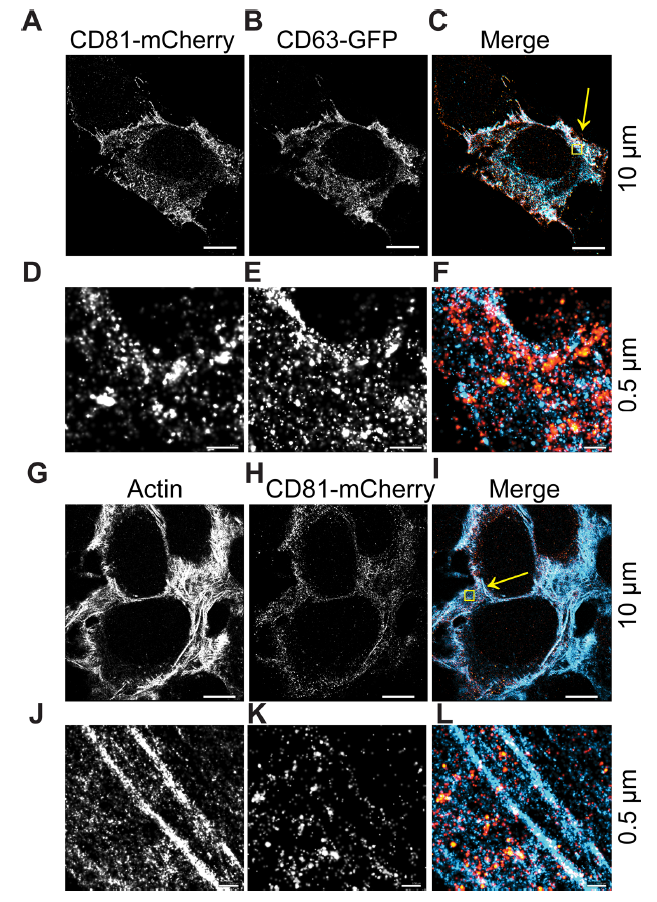
圖2.DC81和CD63細胞內共定位區域
(A-C) CD63-GFP and CD81-mCherry U-2 OS expressing cells were visualized by dSTORM. (D–F) Zoomed-in view of yellow box in C. (G–I) CD81-mCherry does not co-occupy regions with β-actin, as visualized by dSTORM. (J–L) Zoomed-in view of yellow box in I. Scale bars are shown with corresponding values on the right for each row of panels
dSTORM系統能夠在橫向(XY)軸上實現±16 nm的分辨率,在軸向(Z)軸上達到±42 nm的分辨率。因此能夠區分單個EV和總EV。在此觀察到:10μm範圍內,CD63和CD81共定位在細胞內(圖2A-C)。在0.5μm範圍內,與CD63相比,CD81沿質膜富集,CD63更常見於點狀細胞質區域。CD81-mCherry的大球狀結構域也很明顯,並且同時包含CD63和CD81(圖2D–F,黃色)。作為陰性對照,我們使用β-actin,未觀察到CD81-mCherry與β-actin的共定位(圖2G–L)。
3. 對溶液中單個EV進行dSTORM成像
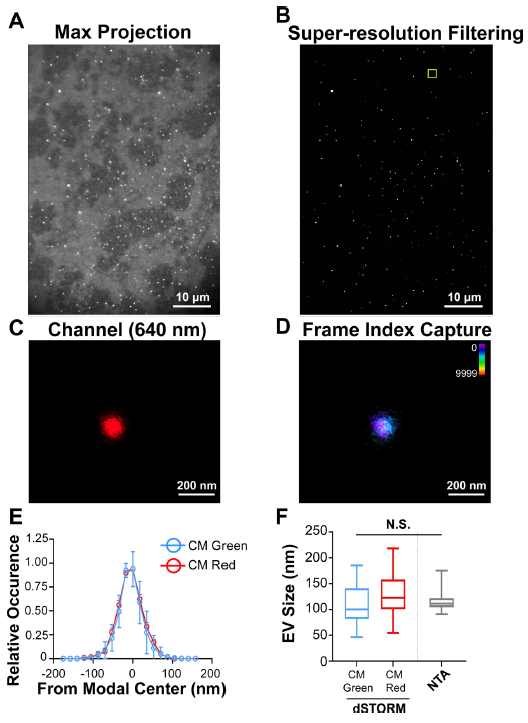
圖3.溶液中單個EV的超分辨率(dSTORM)成像
(A) CD81+ EVs were affinity purified and labelled with the photoswitchable dye CM Red. Max projection image (i.e., pre-dSTORM filtration) is shown. (B) dSTORM filtration of the image in A. (C) Zoomed-in image of a single EV. (D) Frame-index capture of CD81+ EVs in C showing photoswitching throughout the capture. (E) Size distribution analysis of CD81+ EVs viewed through dSTORM using CM Green or CM Red (n = 50 technical replicates, n = 3 biological replicates). (F) Box-Whisker plot of CD81+ EV sizes stained with CM Green or CM Red as measured by dSTORM as compared to NTA
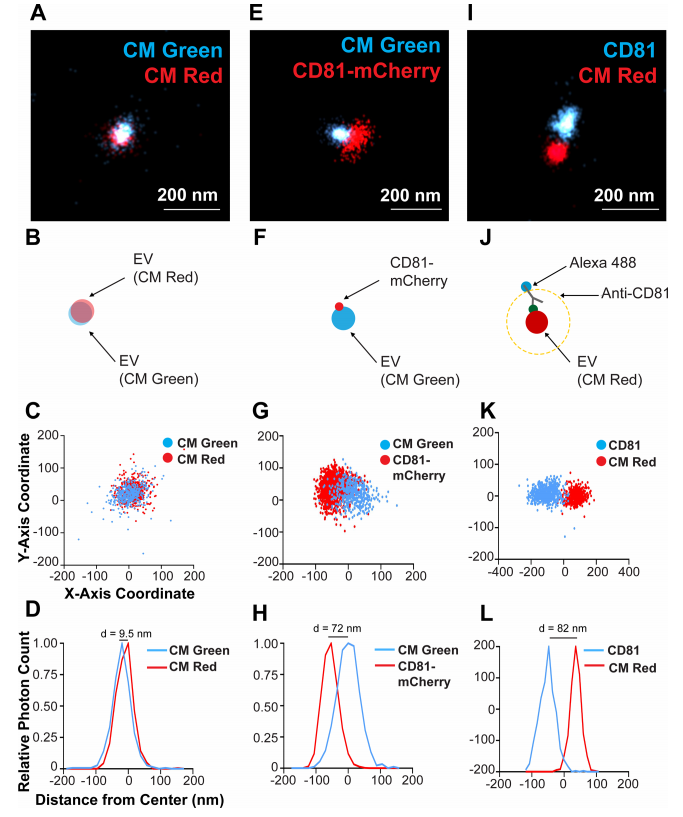
圖4.單個CD81+EV的雙色染色和定位於膜的CD81的可視化
(A) CD81+ EVs were dual stained with CM Green and CM Red and imaged using dSTORM. (B) Scheme of the experimental setup showing the overlap of membrane dyes. (C) X and Y-axis scatter plot of photoswitching events of a small EV shown in B. (D) Photoswitching event distribution of the EV stained with CM Green and CM Red from the modal centre of the EV in the CM Red channel. The distance of modal centres between the channels is shown. (E) CD81-mCherry EVs were stained with CM Green and imaged using dSTORM. (F) Scheme of the experimental setup showing the offset of the membrane dye with the tetraspanin. (G) X and Y-axis scatter plot of photoswitching events of EV in E. (H) Photoswitching event distribution of the EV in F from the modal centre of the CM Green channel. (I) CD81+ EVs from WT cells were stained with CM Red and the endogenous CD81 was stained indirectly using Alex-fluor antibody conjugates. (J) Scheme of the experimental setup showing the offset of the membrane dye with the antibody spacer directed against the tetraspanin. (K) X and Y-axis scatter plot of photoswitching events of EV in I. (L) Photoswitching event distribution of the EV in I from the modal centre between signals
使用dSTORM對溶液中150個EV成像,生成每種染料的尺寸分布概況(圖3A-D),表明EV 尺寸既不是激發/發射波長,也不是染料特異性的,這與NTA分析相當(圖3E-F )。因此,dSTORM 構成了一種在生理條件下確定EV大小的新方法。接下來,EV同時用CM Red和CM Green染色(圖4A- D)。本實驗確定了兩種顏色的EV單粒子分析的分辨率極限: 如果兩個分子的模態峰彼此直徑在d≤10 nm範圍內,則認為它們在同一EV上共定位(圖4A- D)。CD81-mCherry和CM Green在單個EV上沒有共定位(圖4E- H)。CD81分子在EV表面的分布並不均勻,像斑塊一樣集中在 EV 的一個位置,如圖4F所示。
4. 單個EV的3D成像
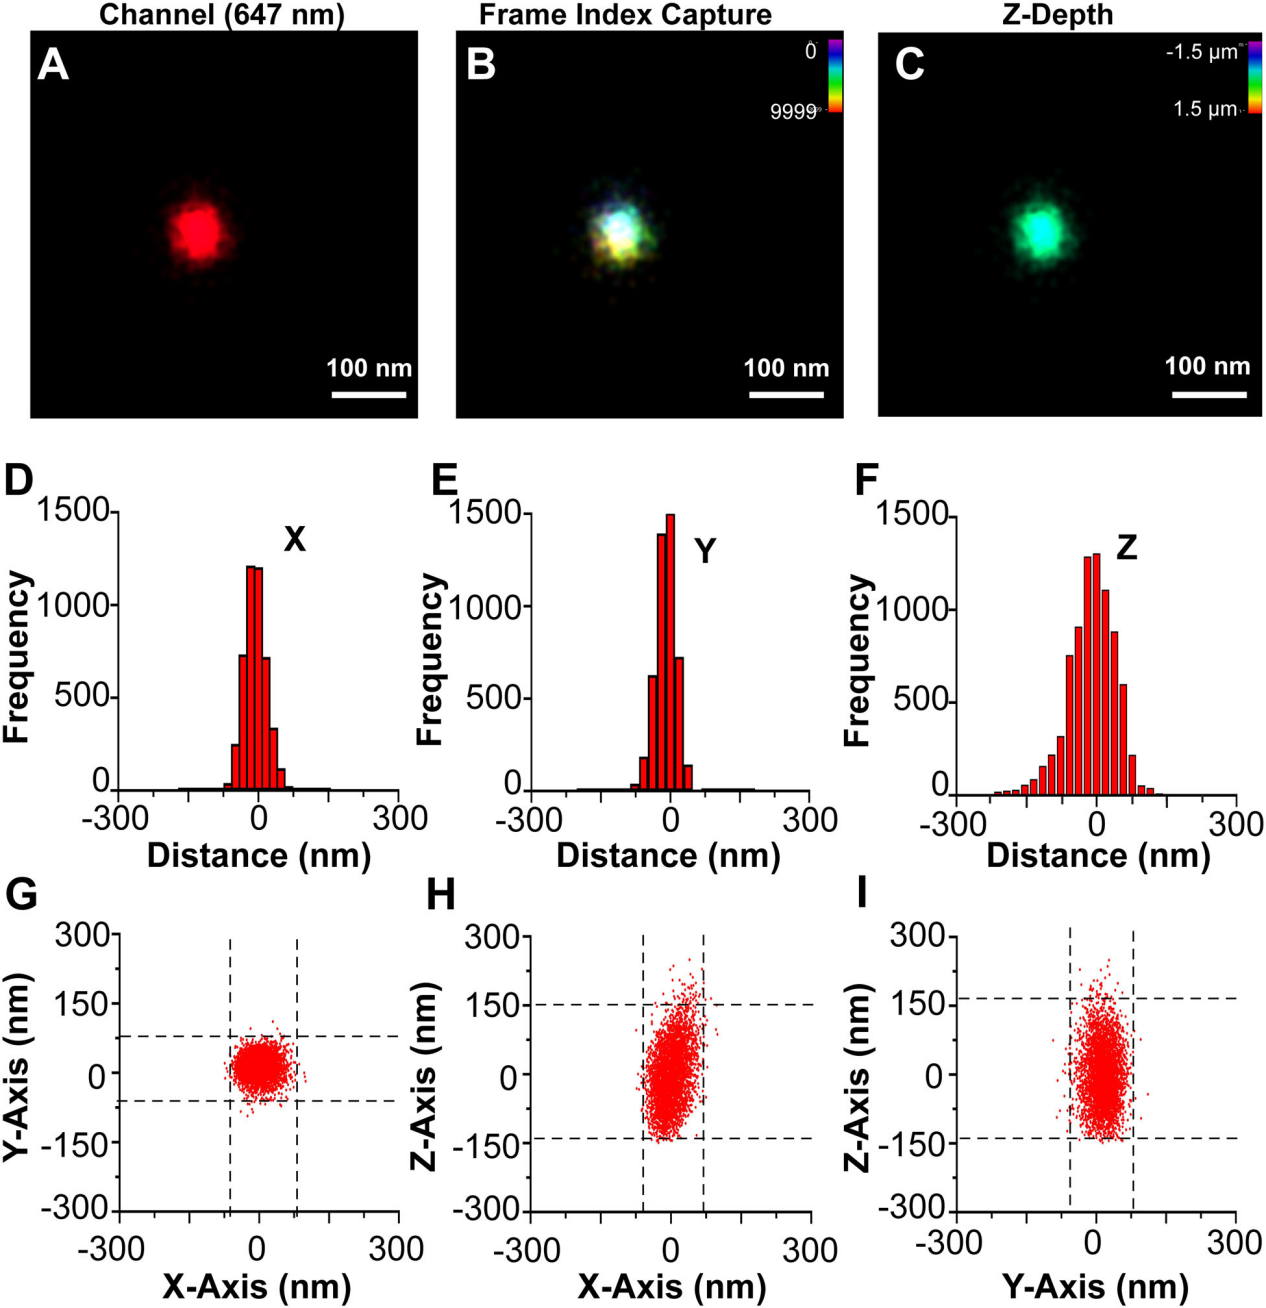
圖5.單個CD81+EV的3D dSTORM
(A) A single CD81+ EV fromWT cells stained with CM Red was visualized by dSTORM with Z-axis astigmatism activated. (B) Frame index capture of the CD81+ EV shown in A. (C) Z-depth information of the CD81+ EV in A. (D) X-axis size histogram of EV with events plotted from the modal centre. (E) Y-axis size histogram of EV with events plotted from the modal centre. (F) Z-axis size histogram of EV with events plotted from the modal centre. (G) X and Y-axis scatter plot of photoswitching events of an EV. (H) Same as G, but for the X-Z axis. (I) Same as G, but for the Y-Z axis
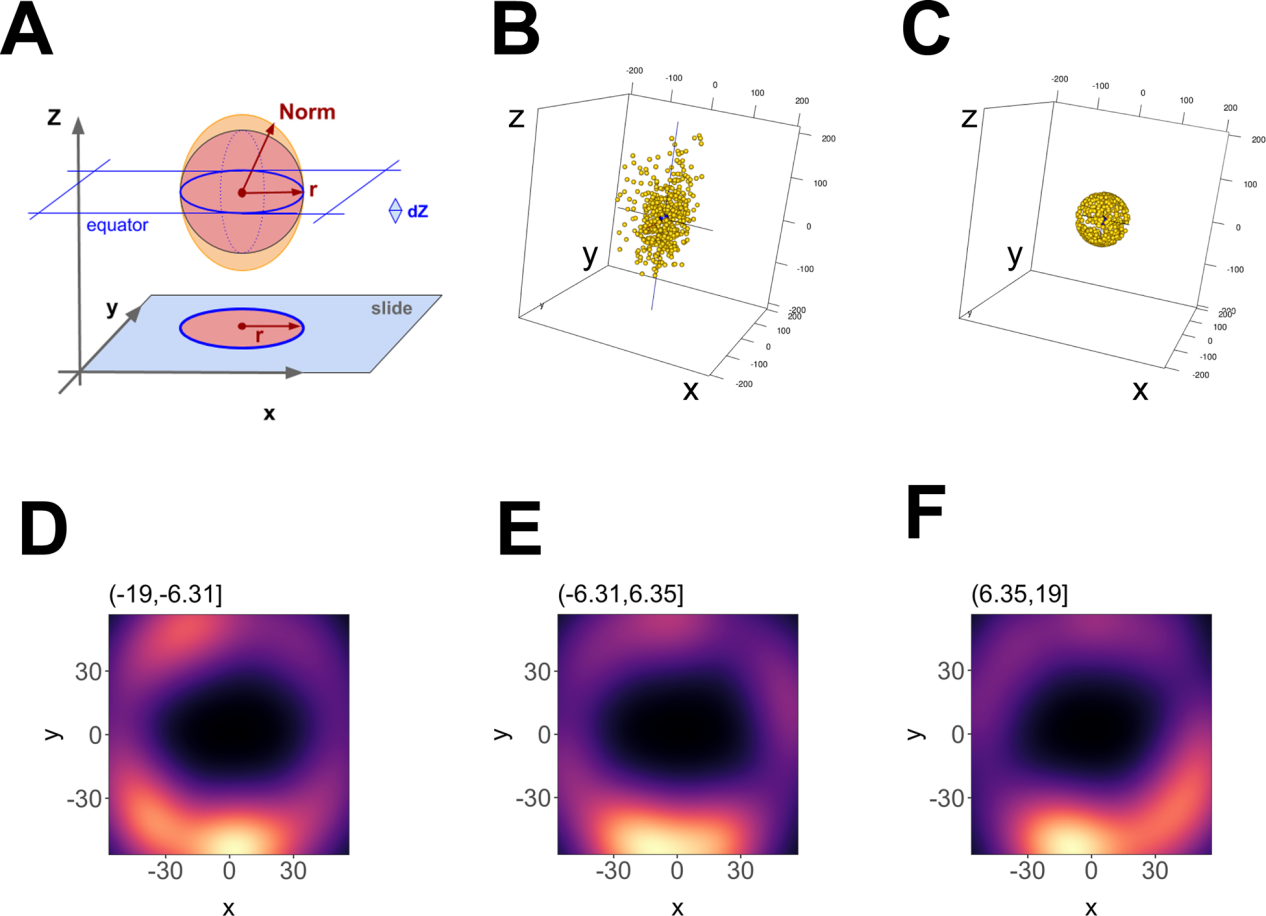
圖6.單個EV的三維重建
(A) Outline of the geometric foundation, with 「slide」 indicating the focal plane at z = -max. The filled red circle and red radius depict how a 2D image would look like. Above, the red sphere indicates the ideal EV, and the orange ellipsoid indicates the actual data. The red arrow r = sqrt (x2 + y2) depicts the radius at the equator, whereas 「Norm」 indicates the point vector from the centre to any point on the ellipsoid surface.Norm = sqrt (x2 + y2 +z ), which at z = 0 equals r. (B) 3-D representation of the data before transformation and (C) after transformation. (D) Principal component analysis (PCA) plot of an EV using 12 nm Z-axis binning of photoswitching events, showing hollowed core. (E) Same as D, but for a bin at one Z-axis increment shift. (F) Same as E, but for a bin at one Z-axis increment shift
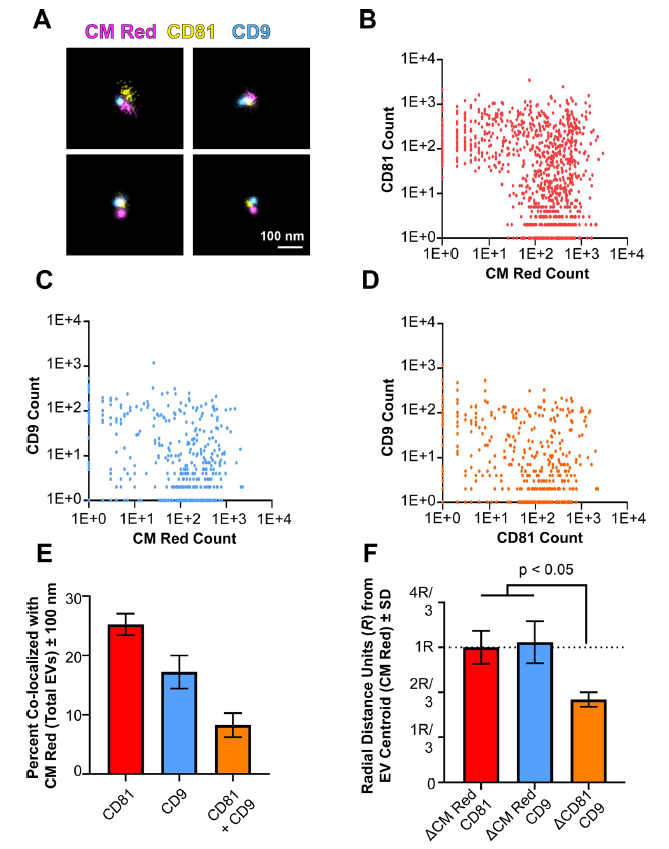
圖7.單個EV表面的四次跨膜蛋白簇
(A) Three-colour dSTORM was performed on total EVs using emissions from CM Red,CD81-mCherry, and anti-CD9 Alexafluor-488. Four representative images are shown: scale = 100 nm. (B) Clustering of photoswitching events of total EVs that were positive for CMRed and CD81-mCherry. X- and Y-axis show events collected post-super-resolution filtration in log scale. The max radius between modal centroids allowed was 150 nm (C) Same as B, but for co-localizing events for CM Red and CD9. (D) Same as B, but for co-localizing events for CD81-mCherry and CD9. (E) The total number of EVs per exposure was quantified using the non-specific membrane-intercalating dye CM Red and co-localizing frequencies were determined for CD81, CD9, or both. (F) The distance between modal centroids was determined between CM Red and CD81, and set to 1 radial measurement, R (dotted line). This was then compared to the distance between the centre of an EV and CD9, as well as between CD81 and CD9. For all experiments, three independent exposures were taken with > 900 individual EVs identified through CM Red clusters
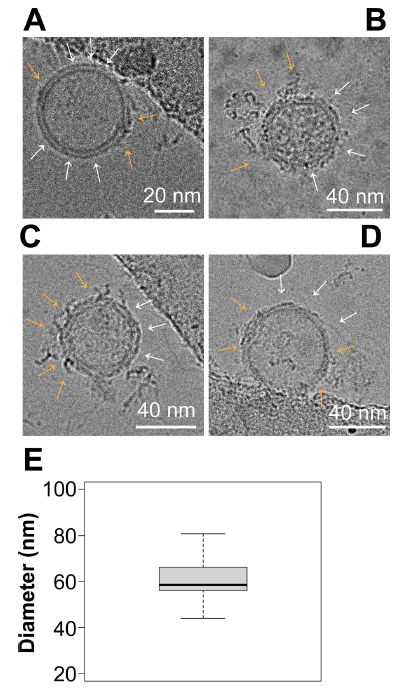
圖8.Cryo-EM顯示EV表面有富含蛋白質的簇
(A–D) Representative images of EVs viewed under Cryo-EM. Surface nanodomains are shown with an orange arrow, highlighting the protein and/or lipid-dense regions of an individual EV. Empty regions are shown with white arrows. (E) Size analysis of EVs viewed through Cryo-EM. EVs were measured in diameter in nanometers based on their lipid bilayer and do not include protruding proteins from the surface
在多個軸向(Z)深度處收集光開關事件(圖5A- C)。3D dSTORM與傳統顯微鏡一樣,沿z軸的分辨率小於沿XY軸的分辨率(圖5D-F ),使用dSTORM在三維和多色通道中完成對單EV重建,這種直接可視化可用於確定 EV 表面上結構域和蛋白質復合物的存在,如圖6所示。
為了進一步提供局部結構域的證據,對單個EV表面的兩種不同的四次跨膜蛋白進行了3D成像,CMRed和CD 81- mCh erry 陽性的EV被鑒定為雙陽性(圖7B)。CD9也與CM Red 共定位,但出現在較少的EV上(圖7C)。最後,僅對 CM Red 陽性的信號繪製兩種四次跨膜蛋白的EV信號(圖7D)。該方法鑒定了僅攜帶CD81的EV、僅攜帶CD9的EV和同時攜帶CD81和CD9的EV。異位過表達的CD81- mCherry在總EV中的定位水平(25.26 %±2.58 )高於CD9(17 .23 %± 3.94 )(圖7E)。
冷凍電鏡(Cryo-EM)可以獲得分子結構的埃級(Å)細節,尤其是對於病毒這樣較大的生物實體:EV平均直徑為 60.3±10.5 nm (mean±sd, 95 % CI = 51.75 - 68.93,n=9個獨立圖像/每組,3組生物學重復)(圖 8E),大小符合預期。根據EV的方向和截面,在單個EV上可以看到多個域(圖 8A-D )。黃色箭頭表示蛋白質和脂質密集區域,白色箭頭表示沒有蛋白質或脂質密集斑塊的區域。冷凍電鏡(Cryo-EM)結果與3-D dSTORM結果一致,證明了EV表面存在不同的微結構域。
結果討論
作為 3d dSTORM在EV上的應用,本研究旨在揭示和記錄EV的結構異質性,並研究EV 膜微區。結構表面組織和組成復雜性是EV和人工脂質體之間的關鍵區別,人工脂質體只包含有限數量的不同脂質,不含蛋白質。通過dSTORM可以識別單個和不同尺寸EV表面的四跨膜蛋白。這點得到了Cryo-EM的驗證。總之,我們的研究表明,EV包含以前未被識別的表面結構和空間組織。對EV表面組裝的進一步研究可能會對其細胞內組裝、特定包裝和組織特異性目的地產生新的見解。
dSTORM Training Kit
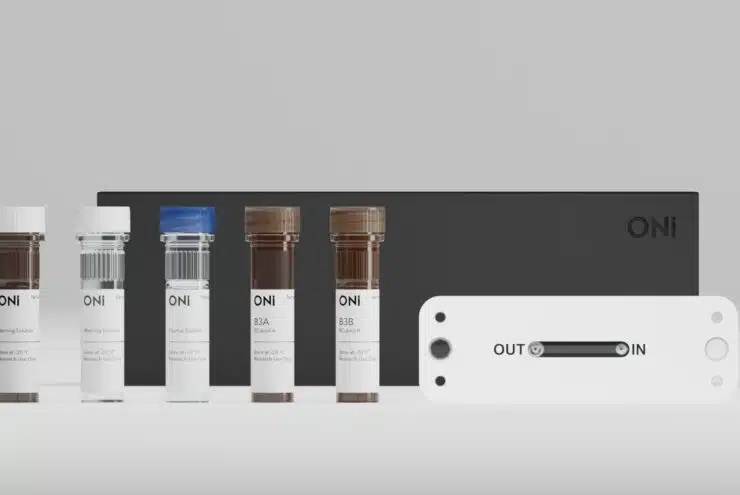
近日,Oxford Nanoimaging新開發的dSTORM Training Kit已發布 。使用此試劑盒,您不僅可以體驗簡潔方便的超分辨顯微成像工作流程,還可以學習單分子定位顯微鏡的基本原理:
了解dSTORM成像的樣品製備
用合適的試劑為dSTORM製備樣品
了解dSTORM成像的基礎知識
在Nanoimager上獲取dSTORM數據
在試驗自己的樣品前獲取自信
分析CODI上的dSTORM數據
如果您想更多了解,請聯系我們。


